
Introduction
Data preprocessing analysis and visualization using Python is a practical data science project that demonstrates how to clean raw datasets, handle missing values, perform exploratory data analysis, and create meaningful charts and graphs. This project is suitable for B.Tech, B.E., BCA, MCA, and computer science students looking for a Python-based final-year project.
The data preprocessing analysis and visualization using Python project combines popular libraries such as Pandas, NumPy, Matplotlib, and Seaborn to transform raw data into useful insights. It helps students understand data cleaning, statistical analysis, visualization techniques, and the importance of preparing quality data before applying machine learning algorithms.
If you are looking for a ready-to-explore Python data science project, Techie Projects can help you enquire about source code availability, project documentation, setup requirements, and customization options.
🎬 Data Preprocessing Analysis and Visualization Using Python – Project Demo
Watch the project demonstration to understand how the application processes datasets, performs exploratory data analysis, and generates visual reports. The demo illustrates the major stages of a Python-based data science workflow and helps students understand how data is transformed into useful information.
🎯 Data Preprocessing Analysis and Visualization Using Python – Project Overview
The Data Preprocessing Analysis and Visualization using Python project focuses on preparing raw data for reliable analysis. It combines data-cleaning techniques, statistical exploration, and visualization methods in one practical implementation.
The project can be adapted to different datasets depending on the academic requirements. Students can use it to understand data quality, identify patterns, and communicate findings through graphical representations.
Main Objectives
- Clean datasets by handling missing and duplicate values.
- Transform data into a consistent format for analysis.
- Perform exploratory data analysis (EDA).
- Generate charts and graphs to identify patterns and trends.
- Summarize important findings using statistical methods.
- Understand how preprocessing supports machine learning workflows.
⚙️ Key Features of Data Preprocessing Analysis and Visualization Using Python
1. Data Loading
Load structured datasets from supported file formats such as CSV. The dataset can contain information related to sales, education, business, healthcare, or another suitable domain.
2. Data Cleaning and Preprocessing
Apply preprocessing operations such as handling missing values, removing duplicate records, correcting data types, and preparing columns for further analysis.
3. Exploratory Data Analysis
Explore dataset dimensions, column information, descriptive statistics, value distributions, and relationships between selected variables.
4. Data Visualization
Create visual representations such as bar charts, line graphs, histograms, scatter plots, and correlation heatmaps where appropriate. These visualizations make patterns easier to interpret.
5. Statistical Summary
Generate descriptive summaries to understand numerical distributions and compare relevant variables in the dataset.
6. Customization Options
The project can be adapted to a suitable dataset, academic problem statement, or additional analysis requirements, subject to the selected implementation.
🔄 How the Python Data Preprocessing Project Works
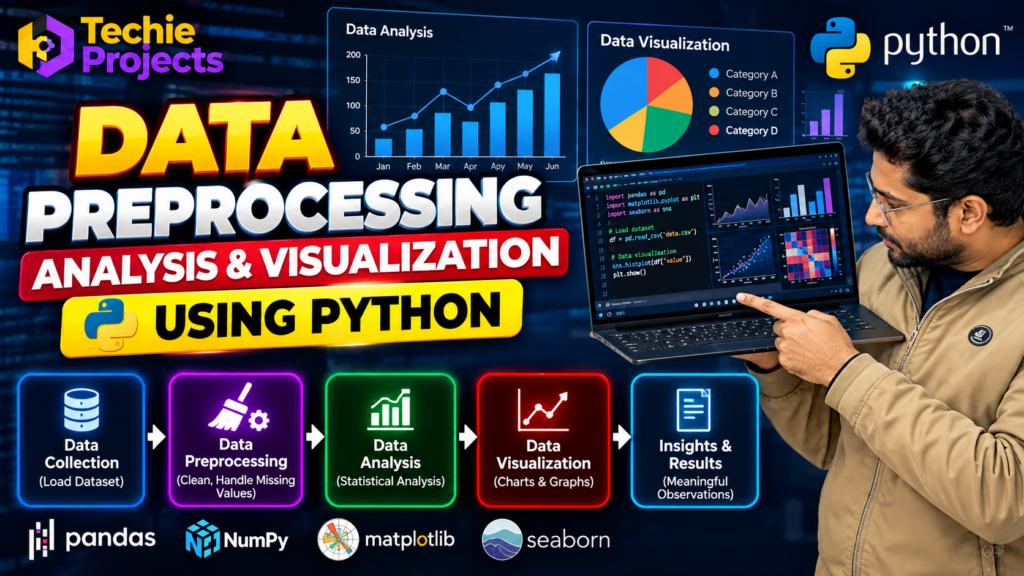
The Data Preprocessing Analysis and Visualization using Python project follows a structured workflow:
- Dataset collection: Select and load a relevant dataset.
- Data inspection: Examine columns, data types, missing values, and duplicate records.
- Data preprocessing: Clean and transform the dataset.
- Exploratory analysis: Calculate descriptive statistics and explore variable relationships.
- Visualization: Generate appropriate charts and graphs.
- Interpretation: Review the results and identify useful observations.
- Output generation: Present the processed data and analysis results.
This workflow helps students understand the practical stages involved in preparing data for analytics and machine learning.
🛠️ Technologies Used in Data Analysis and Visualization
The project can use the following technologies, depending on the implementation:
- Programming language: Python
- Pandas: Data manipulation and cleaning
- NumPy: Numerical operations
- Matplotlib: Data visualization
- Seaborn: Statistical charts and visual exploration
- Jupyter Notebook or an appropriate Python IDE: Development and execution
The exact libraries, modules, and interface depend on the delivered project version.
💻 Software and Hardware Requirements
Software Requirements
- Python 3.x with compatible library versions
- Pandas and NumPy
- Matplotlib and Seaborn
- Jupyter Notebook, VS Code, or another compatible Python environment
- Windows, Linux, or another supported operating system
Hardware Requirements
- A computer or laptop capable of running Python
- Recommended minimum of 4 GB RAM; 8 GB or more is preferable for larger datasets
- Sufficient storage for datasets, libraries, and project files
Actual requirements may vary according to dataset size and implementation.
🎓 Applications of the Project
The techniques demonstrated in this project are useful in several domains:
- Education: Analyze student performance and academic results.
- Business: Explore sales data and customer trends.
- Healthcare research: Prepare suitable datasets for exploratory analysis.
- Finance: Examine structured financial records.
- Retail: Study product performance and purchasing patterns.
- Machine learning: Prepare datasets before model training.
The project is primarily an educational data analytics implementation. Its findings depend on the dataset quality and the analysis methods used.
📈 Advantages of Data Preprocessing and Visualization
- Improves understanding of raw datasets.
- Helps identify missing values, duplicates, and inconsistencies.
- Makes complex information easier to interpret.
- Supports exploratory analysis before machine learning.
- Provides practical experience with popular Python libraries.
- Can be extended to different domains and academic requirements.
🚀 Future Scope
Students can extend the project by adding an interactive dashboard, automated data-quality reports, additional statistical analysis, or a machine learning model. A web interface using Streamlit can also be considered if interactive data uploads and visual reports are required.
These extensions depend on the available time, dataset, and project scope.
🎓 Who Can Purchase This Project?
The Data Preprocessing Analysis and Visualization using Python project may be suitable for:
- B.Tech and B.E. Computer Science students
- Information Technology students
- BCA and MCA students
- Data science and analytics learners
- Students preparing Python mini-projects or final-year demonstrations
If you need a project for an academic demonstration, confirm the included features, documentation, source code, and customization requirements before ordering. Use the project to learn the implementation and follow your institution’s academic-integrity rules.
💼 Get the Data Preprocessing Analysis and Visualization Project
Looking for a Python data analytics project for your final-year submission? Techie Projects provides project-related assistance for students exploring Python, data science, machine learning, and computer vision projects.
Contact us to ask about project availability, source code, setup instructions, documentation, and customization options.
- 📲 Call/WhatsApp: +91-9460060699
- 🌎 Website: www.techieprojects.com
- 📺 Instagram: @pythonprojects_
Send your requirements to discuss the available project version and pricing before purchasing.
🎓 Explore Related Projects
Explore more project ideas and implementations from Techie Projects:
- House Price Prediction Using Machine Learning
- Fake News Detection Using Machine Learning
- COVID-19 Data Analysis and Visualization
- Credit Card Fraud Detection Using Machine Learning
- Crop Yield Prediction Using Machine Learning
- Movie Recommendation System Using Python
For individual project pages, use the corresponding published URLs on Techie Projects when available.
❓ Frequently Asked Questions
1. What is a data preprocessing and visualization project?
It is a Python-based project that prepares raw data for analysis and presents useful information through statistical summaries, charts, and graphs.
2. Which Python libraries are useful for this project?
Pandas, NumPy, Matplotlib, and Seaborn are commonly used for data preparation, numerical processing, and visualization.
3. Can this project be used for a final-year engineering submission?
It can be suitable for an academic project, depending on your department’s requirements, the scope of implementation, and the documentation required.
4. Can I customize the project for my dataset?
Customization may be possible depending on the requested dataset, features, and available implementation. Contact Techie Projects to discuss your requirements before purchasing.
5. How can I get the project source code?
Visit Techie Projects or contact us on WhatsApp to confirm availability, deliverables, and pricing.
Conclusion
The data preprocessing analysis and visualization using Python project gives students practical experience in dataset preparation, exploratory analysis, and visual reporting. It can also be extended with interactive dashboards, automated data-cleaning features, and machine learning workflows based on project requirements. Contact Techie Projects to discuss project availability, source code, and customization options.
The Data Preprocessing Analysis and Visualization using Python project provides a practical way to learn data cleaning, exploratory data analysis, statistical summaries, and graphical reporting. It helps students connect Python programming with real-world data analytics workflows.
If you want to explore this project for your academic requirements, contact Techie Projects to discuss the available implementation, source code, and customization options.